
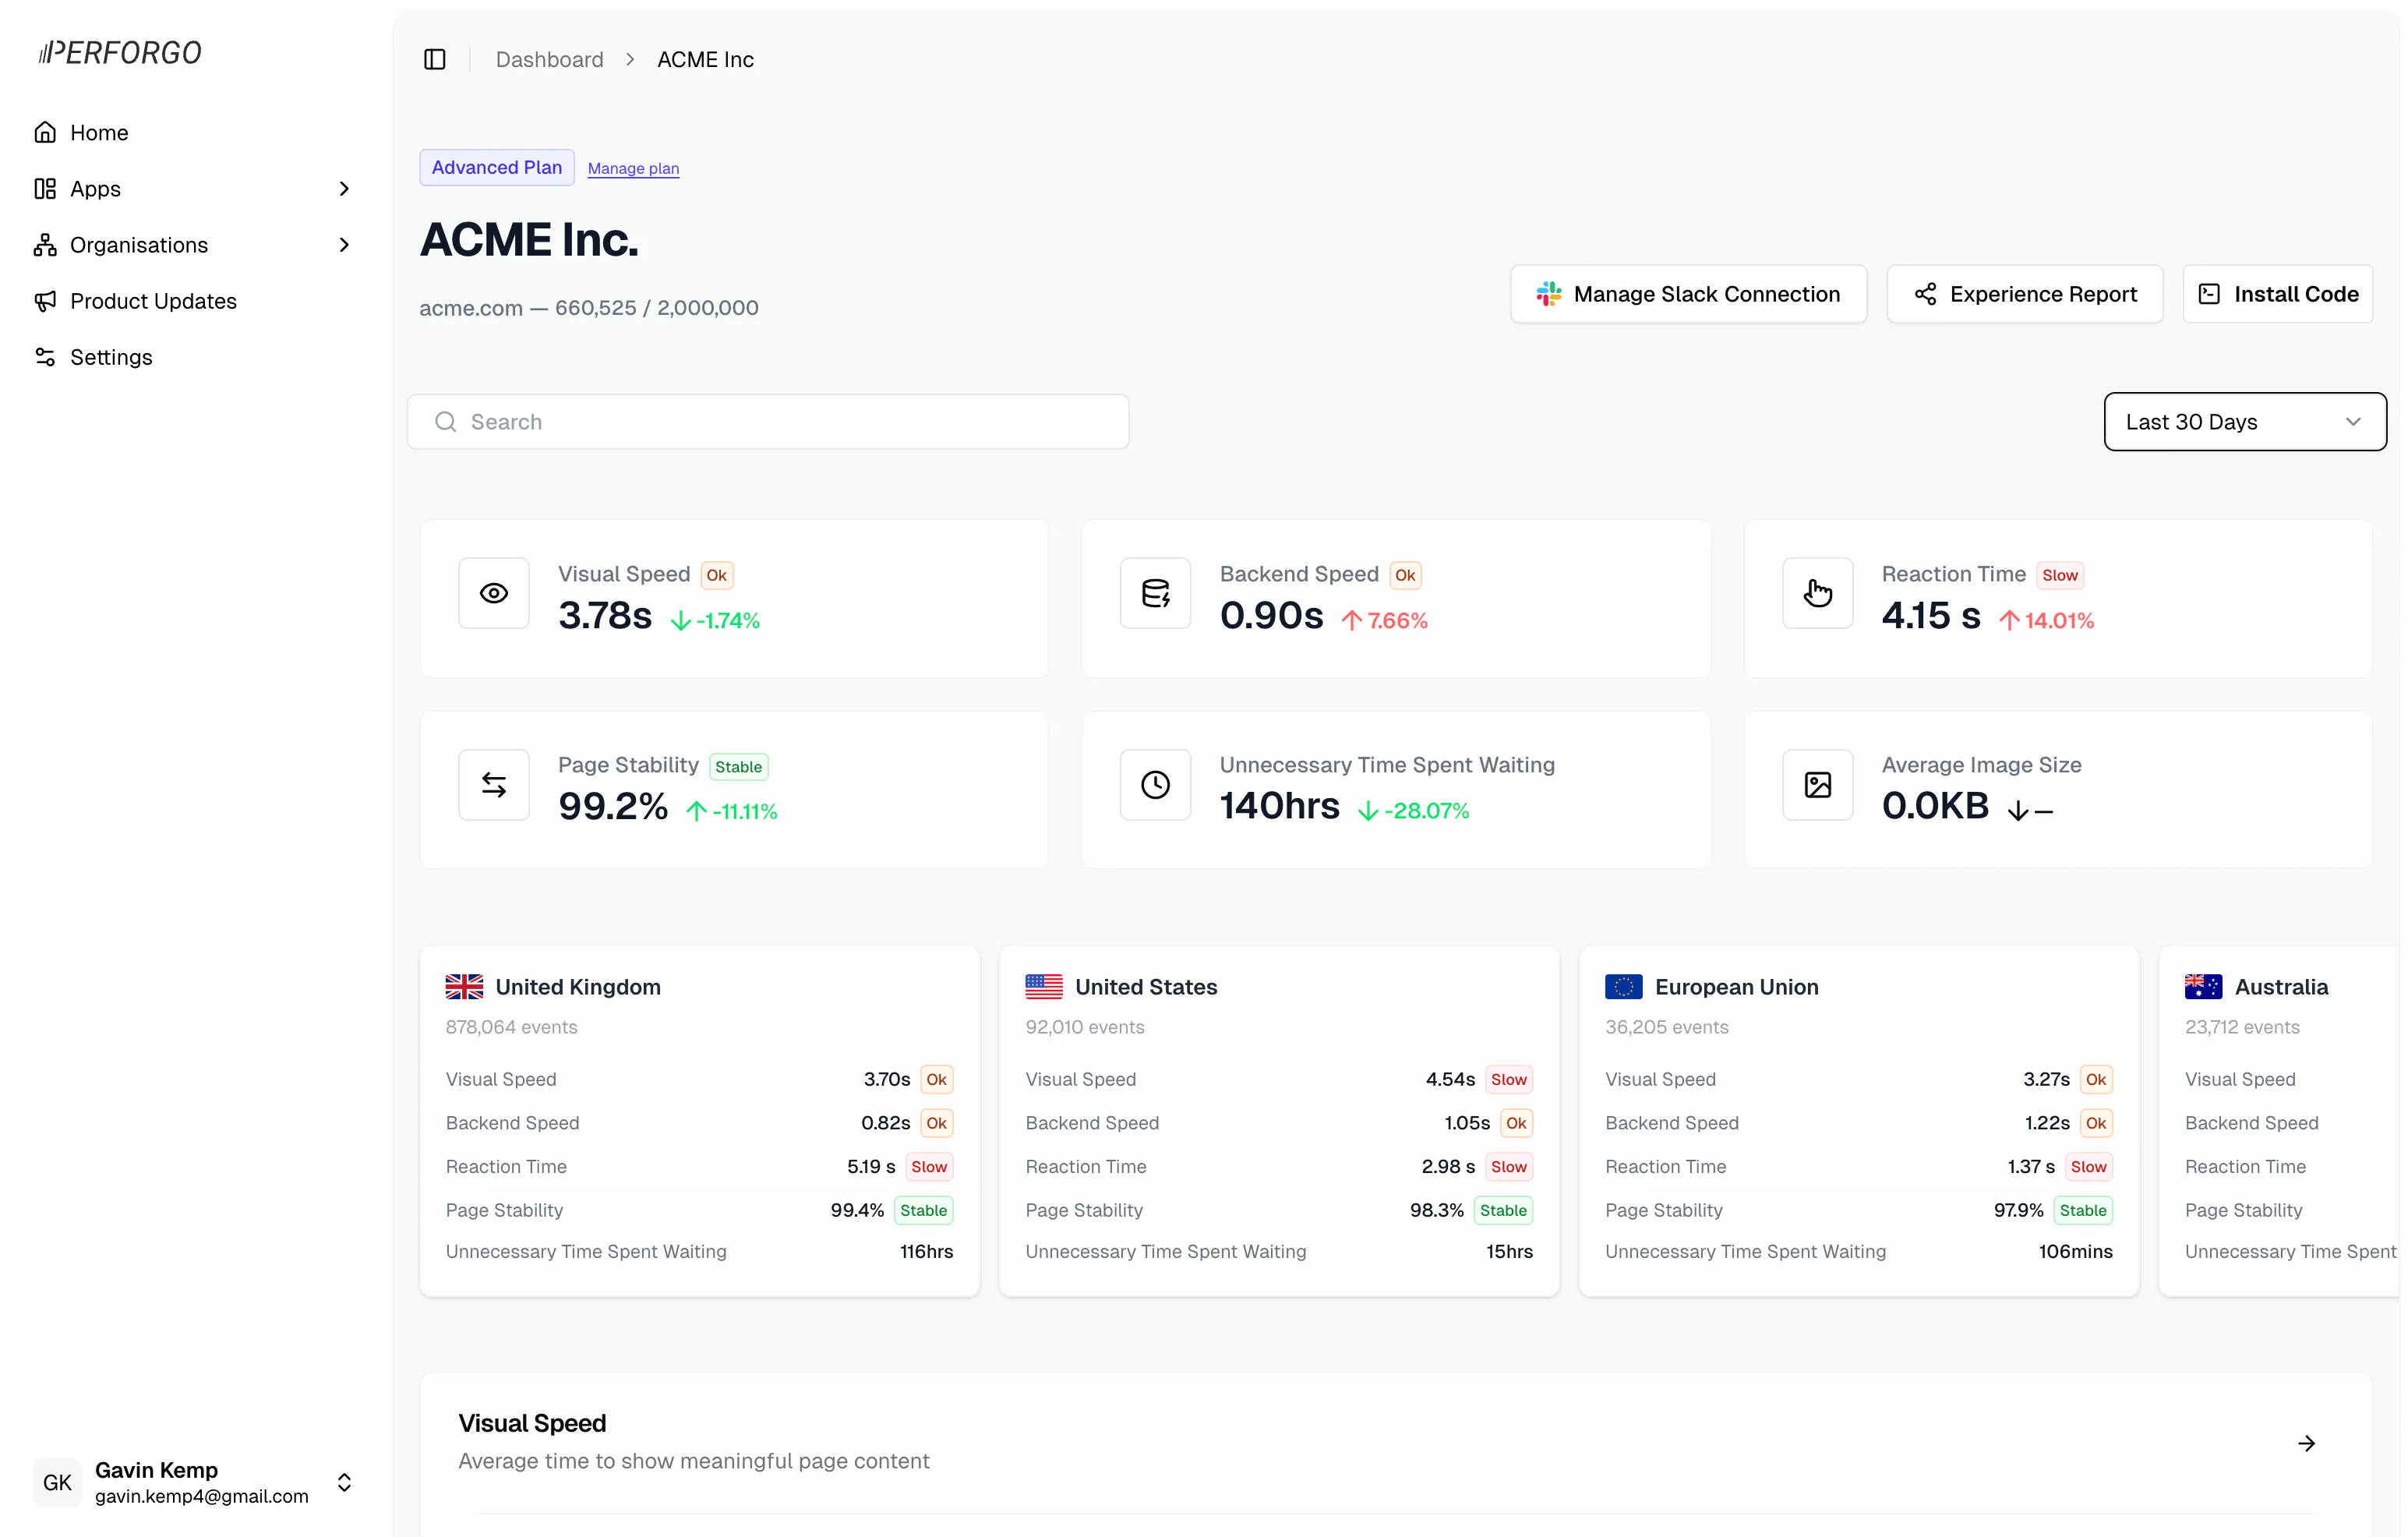
Analyse performance by page locales
If your website has localised page paths, such as: /en, /fr, /nz, /us as examples, you can now see performance breakdowns grouped by those path prefixes in the Perforgo dashboard. No additional setup required.
All prefix formats are supported such as: /gb/*, /en-gb/* /en_gb/*
Other Updates
Page experience summaries now in Slack
Perforgo can now send your website performance summary to Slack.
Find The Slowest Trending Pages Quickly
Discover trending pages with the highest % of slow visits to quickly identify page speed issues on pages gaining traction.
Refreshed billing portal that does more
We've refreshed the billing portal to give you more information and control.
Searching for pages is now available
Finding specific pages is now possible through a search bar on the dashboard